Academic economists, think tanks, and research institutions need to test structural hypotheses across multiple countries simultaneously, with reproducible probabilistic outputs that can withstand peer review.
WorldSim provides the simulation infrastructure that would take a research team 6-12 months to build from scratch: 26 KPIs, 100+ coupling rules, 195 countries, and full distributional outputs with deterministic reproducibility.
Current academic workflows are deep on single questions but slow to scale across countries and domains.
Built in R, Python, or Stata over 6-12 months per paper. Each model covers 3-5 variables for a narrow research question. Cross-domain coupling is rarely modelled because it requires a full structural engine.
Deterministic demographic projections with no uncertainty bands and no structural coupling to fiscal, labour, or migration variables. Widely used but cannot model how demographic change interacts with economic policy.
Calibrated on historical data with limited forward-looking capability. Excellent for identifying historical relationships, but cannot generate the kind of counterfactual scenario analysis that policy-oriented research requires.
Building a structural scenario model from scratch takes 6-12 months. By the time the paper is submitted, the policy window may have closed. Research that matters needs to be produced faster without sacrificing rigour.
Focus on your research question, not on building the engine. WorldSim provides the structural simulation layer so you can go straight to hypothesis testing.
Every simulation is identified by a unique run group ID and fixed seed. The same configuration always produces identical results. This meets the reproducibility standard that peer review demands, and enables other researchers to verify and extend your work.
Test a structural hypothesis across 10, 50, or 195 countries simultaneously. "Does higher R&D spending correlate with better demographic outcomes?" Run the same scenario everywhere, compare the distributions, and publish the finding.
The 100+ coupling rules are themselves a research contribution: empirically calibrated structural relationships between macroeconomic variables. Researchers can study the coupling dynamics, propose new rules, and validate against historical data using the built-in Validation Engine.
Generate 10,000 trajectories per country with P10/P50/P90 quantiles, histograms, and regime classifications. These distributional outputs are publication-ready: fan charts, distribution comparisons, and structural bucket scores for any pair of countries.
WorldSim's 26 KPIs span the structural dimensions most commonly studied in economic and demographic research:
Each question maps to a reproducible scenario configuration that generates publication-ready distributional outputs.
Compare Romania (fertility 1.75, rising) vs Sweden (fertility 1.4, falling) with full distributional outputs. WorldSim reveals the surprising result: Romania's demographic outlook may be structurally stronger than Sweden's.
WorldSim couples migration to R&D spending, high-tech exports, and GDP through structural rules. Tilt net migration negative and observe the cascade: skills loss, innovation decline, further emigration.
WorldSim models the structural interaction between 65+ share, aggregate government expenditure, tax base erosion, and migration simultaneously. Compare how countries with different starting fiscal positions respond to the same demographic pressure over 25 years.
Romania's GDP grows +46% vs Sweden's +0.7% in our baseline simulation. But convergence isn't just GDP: compare housing, demographics, technology, and energy trajectories to assess whether structural convergence is real or superficial.
Sweden pushes renewables to 90.6% by 2050 while Romania stays at 28.2%. WorldSim models the downstream effects on electricity prices, inflation, and GDP for both, revealing whether the green transition is a structural advantage or a cost burden.
Need synthetic data for a panel regression? WorldSim generates structurally coherent trajectories across any set of countries, with full audit trail and reproducibility. Every trajectory respects the coupling rules that govern real macroeconomic dynamics.
The EU's demographic decline is the defining structural challenge of the next 30 years. But the pattern is not uniform: Romania's fertility (1.75) is among the highest in the EU, while Sweden's (1.4) is declining from its historically high level. WorldSim reveals these divergent trajectories and their fiscal consequences.
Post-EU accession emigration from Romania, Bulgaria, Poland, and the Baltics transformed both origin and destination countries. Yet Romania's WorldSim trajectory shows net migration turning positive (+5.1/1000 by 2050), suggesting the brain drain may be reversing as GDP convergence attracts returnees.
The EU's R&D gap is well-documented but the within-EU divergence is less studied. Sweden invests 3.56% of GDP in R&D (rising to 4.14%), while Romania invests 0.46% (falling to 0.4%). WorldSim models how this gap interacts with brain drain, high-tech exports, and long-term productivity.
Sweden's structural model faces mounting challenges: Housing TI collapses to 0.16, GDP growth stalls at +0.7%, and 43% of simulation paths hit structural stress. The Scandinavian model that researchers have long studied as an exemplar may be entering a period of structural vulnerability.
Two EU members at opposite ends of the development spectrum, identical baseline conditions. The structural convergence question that defines European economic research, produced with full distributional outputs.
Romania's structural outlook is surprisingly resilient. GDP grows 46% ($22,436 to $32,757) with an expansionary Income TI of 0.71. Demographics are stable: fertility at 1.75 rising to 1.99, net migration positive at +5.1/1000. Housing becomes a Buyer's Market as price-to-income drops 90%. The vulnerabilities are in Cost of Living (inflation 8.2%, electricity +58%, TI 0.28) and rising crime (+32%). R&D collapses to 0.4% of GDP, signalling an Innovation Stagnation risk despite strong growth.
Sweden's results challenge conventional assumptions. GDP barely grows (+0.7%, $62,036 to $62,483), stagnating from a high base. Housing Affordability collapses to TI 0.16 (rent +14%, price-to-income +14%). Demographics deteriorate sharply: fertility falls from 1.4 to 1.07, net migration declines 35%. The bright spots are Energy (TI 0.98, renewables surge to 90.6%) and R&D (3.56% rising to 4.14%). But 43% of paths hit structural stress, the highest stress probability among Northern European economies.
The Comparison Engine delivers the headline finding: Romania (TI 0.53) outperforms Sweden (TI 0.45) overall. Romania leads on Income (71 vs 51), Housing (52 vs 16), and Demographics (48 vs 16). Sweden leads on Fiscal (55 vs 45) and Energy (70 vs 31). Technology is nearly tied (72 vs 70). This is the convergence story quantified: Romania is improving faster from a lower base across more domains than Sweden, whose structural model is under pressure from housing costs, demographic decline, and GDP stagnation.
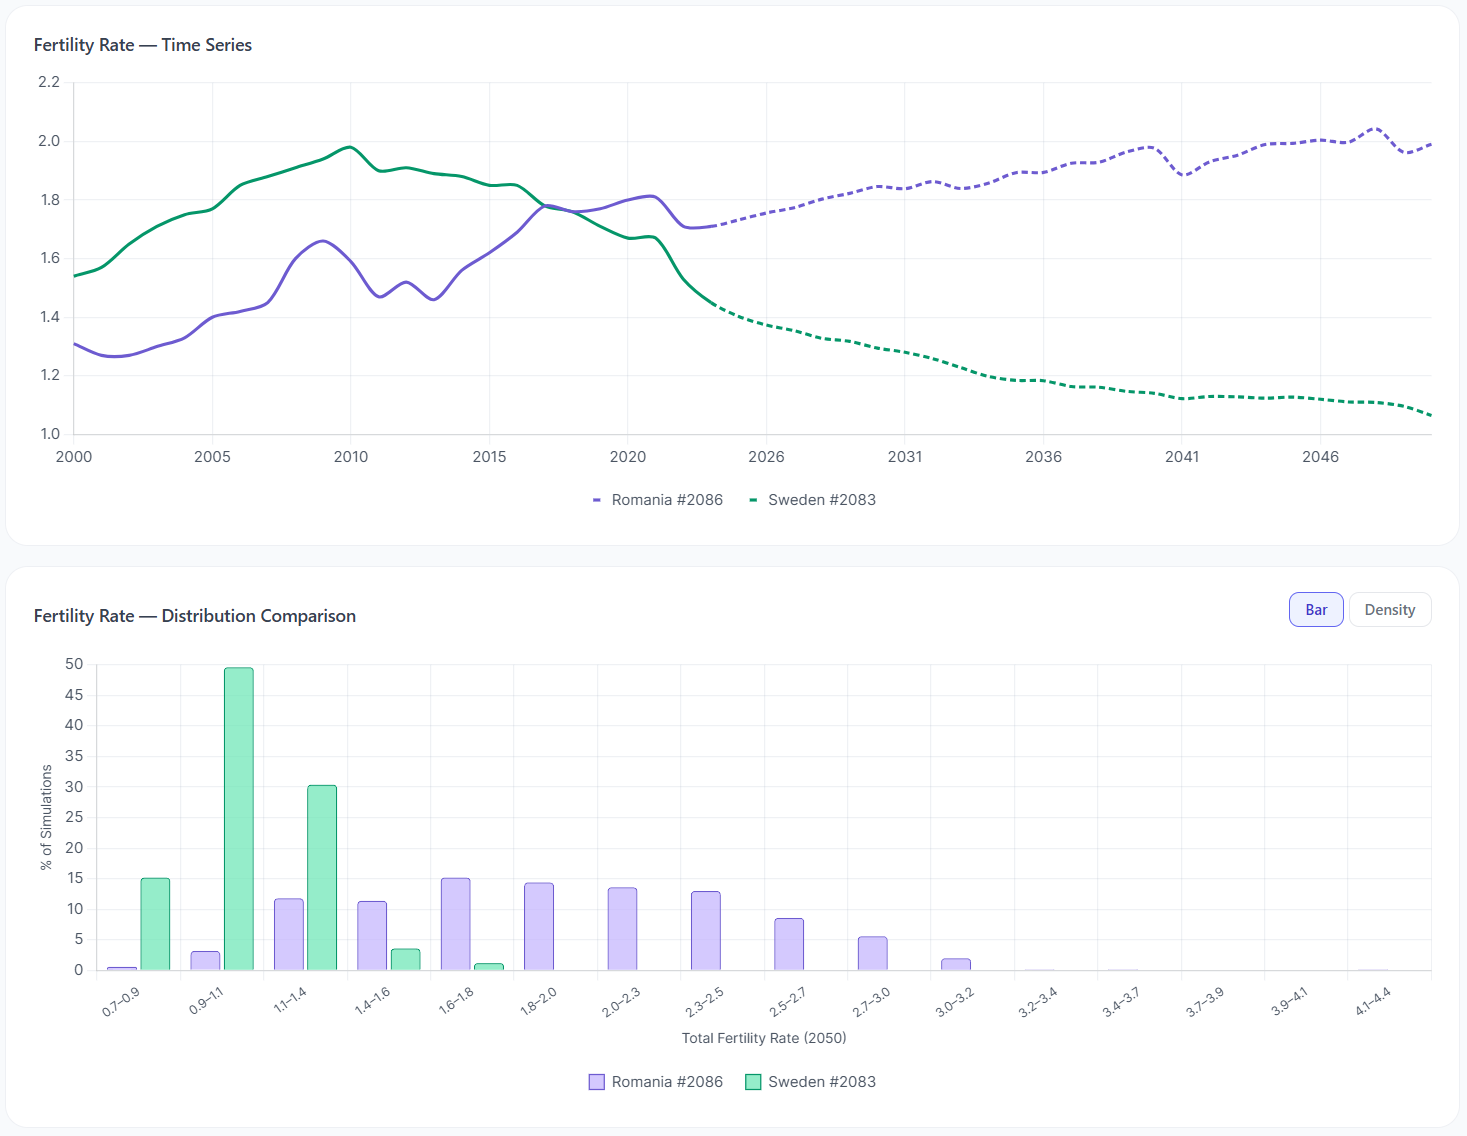
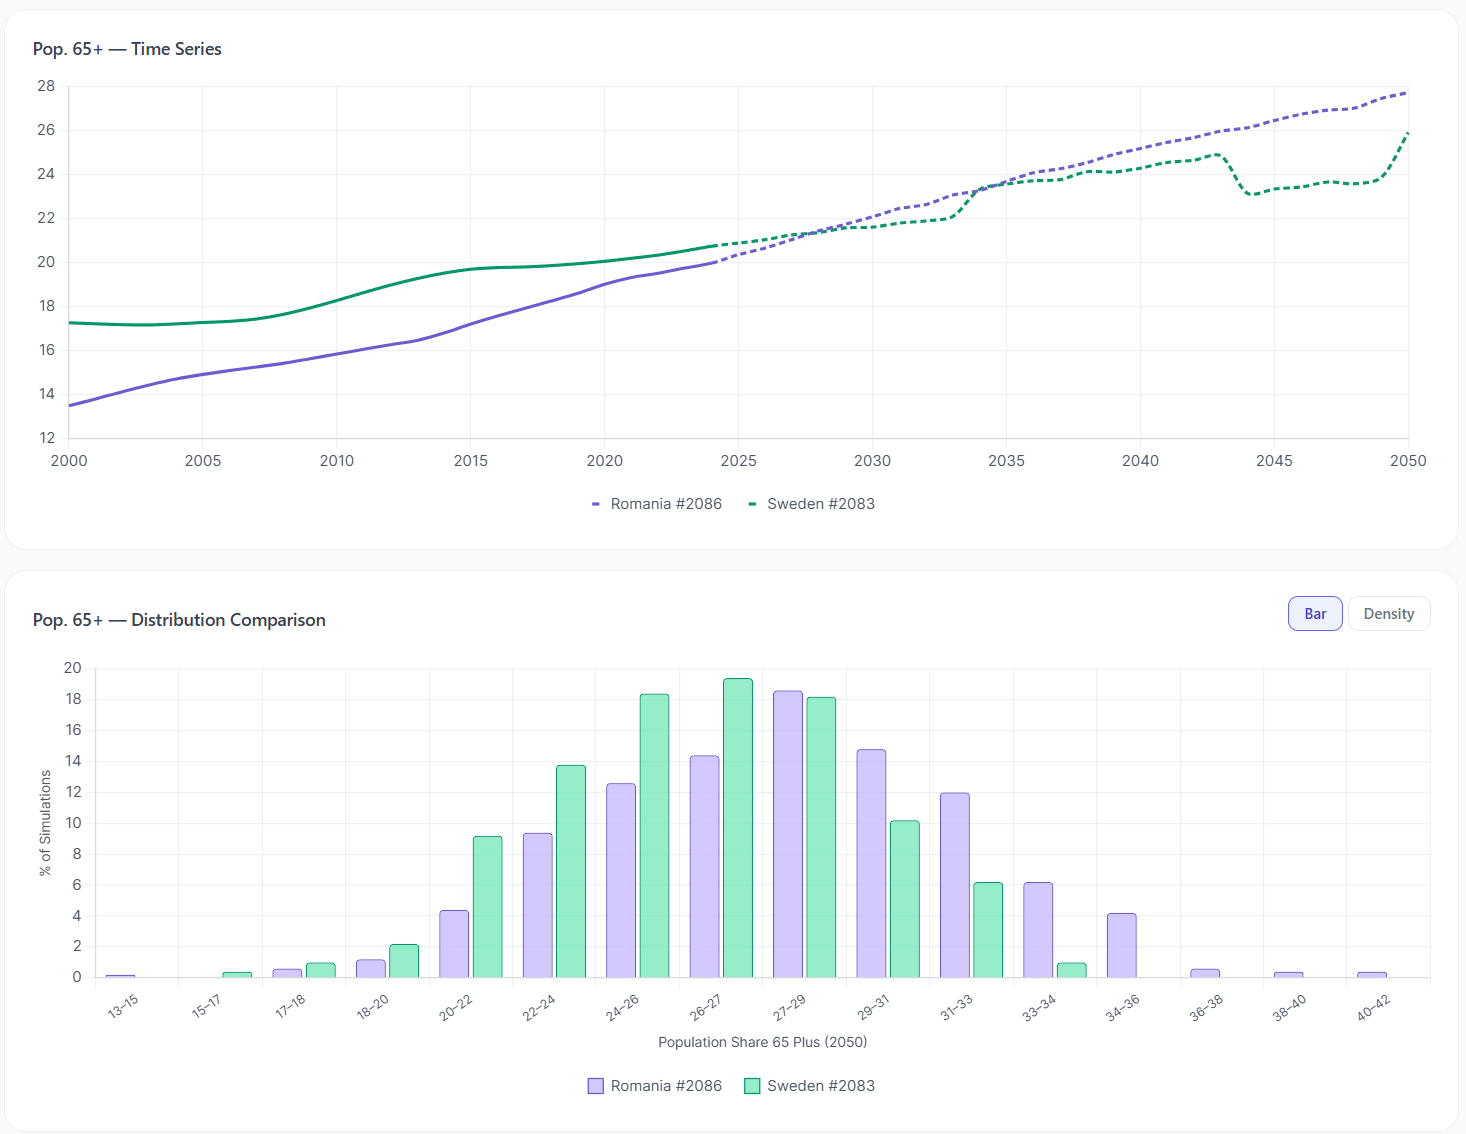
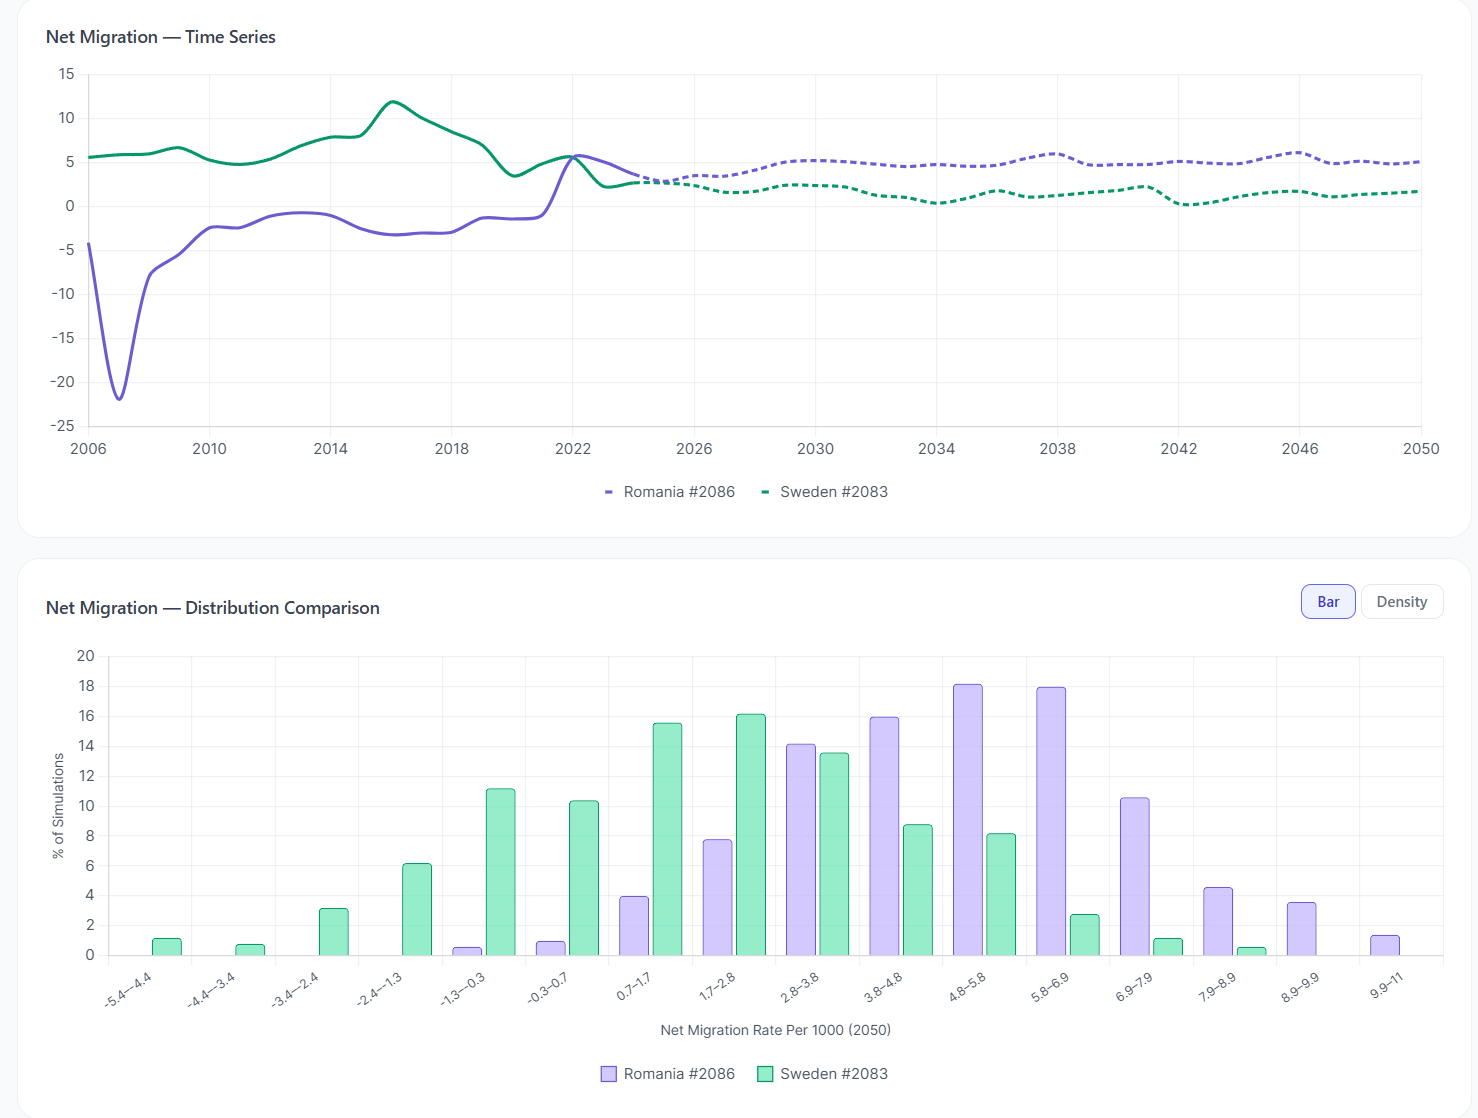
The demographic comparison tells a striking story. Fertility: Romania starts at 1.75 and rises toward 2.0 while Sweden drops from 1.4 to 1.07, a complete reversal of the historical pattern. The 65+ share: both countries age, but Romania's curve is gentler (20.3% to 27.7%) while Sweden's is steeper from a higher base (20.9% to 25.9%). Net migration: Romania's turns strongly positive (+5.1/1000) as GDP convergence attracts returnees, while Sweden's declines 35%. These three demographic KPIs together explain the Demographics bucket gap: Romania 48 vs Sweden 16.
This comparison produces a publication-ready structural finding: EU convergence is real and multi-dimensional, but the pattern is not what the literature assumes. Romania outperforms Sweden on structural trajectory (TI 0.53 vs 0.45) despite starting from less than half the GDP level. The convergence is driven not just by income catch-up (+46% vs +0.7%), but by demographic resilience (fertility rising vs falling), housing affordability (Buyer's Market vs Structural Crisis), and migration reversal (brain drain turning into brain gain). Meanwhile, Sweden's Nordic model faces structural pressures from housing costs, demographic decline, and GDP stagnation that the traditional convergence literature hasn't fully accounted for. A research team using WorldSim can generate this cross-country structural analysis for any pair of countries, with full reproducibility and distributional depth, in the time it takes to write the introduction to a working paper.
Generate reproducible, distributional scenario analysis across 195 countries with 26 KPIs and 100+ coupling rules. From hypothesis to publication-ready output in minutes.