Use Case: Policy Institutions

Cross-Country Structural Analysis at Scale

The IMF, OECD, World Bank, ECB, and EU Commission need to compare structural trajectories across countries under identical conditions, not one country at a time, but dozens simultaneously.

WorldSim produces in minutes what currently takes multilateral teams weeks: full probabilistic structural outlooks across 195 countries with 26 KPIs, 100+ coupling rules, and built-in cross-country comparison.

The Status Quo

How Multilateral Institutions Model Countries Today

Current institutional workflows are deep but slow, and rarely model cross-domain structural coupling.

IMF DSGE Models (GIMF, FSGM)

Article IV consultations take weeks per country. Each uses bespoke DSGE calibration. Cross-country comparison requires separate model runs with different parameterisations; there's no unified structural engine.

OECD Economic Outlook (NiGEM)

Published biannually with deterministic projections. The NiGEM model is powerful but requires specialist economists to operate. Scenario flexibility is limited to what the modelling team can produce within the publication cycle.

ECB Macro Stress Testing

Top-down scenarios for banking supervision with fixed macro paths. Powerful for financial stability but doesn't model the structural coupling between energy, demographics, fiscal, and labour that drives the macro paths themselves.

EU Commission Forecasts

Quarterly economic forecasts for all 27 member states, but deterministic, single-point, and without structural coupling between domains. The reformed Stability & Growth Pact requires scenario analysis that these forecasts don't provide.

The WorldSim Approach

Unified Structural Analysis Across 195 Countries

One engine, one rule set, every country, with full distributional outputs and built-in cross-country comparison.

Cross-Country Comparison Engine

Compare any two countries under identical or different conditions. Spider charts, bucket scores, KPI-level time series overlays, and distribution comparisons: the full structural profile side by side.

All 26 KPIs, Every Country

The same 26 structural indicators simulated with the same 100+ coupling rules for every country. No bespoke calibration needed; the engine adapts to each country's baseline data and sigma structure automatically.

Structural Coupling Transparency

Every rule that fires is logged with its trigger condition, year, and effect. Policy analysts can trace exactly why a country's fiscal position deteriorates: which rules fired, in what order, and how they cascaded across domains.

Distributional Asymmetry Detection

WorldSim reveals when a country has asymmetric risk, like Greece's GDP showing +145% upside vs -60% downside from a low base. This structural asymmetry is invisible in deterministic forecasts but critical for policy design.

Full KPI Coverage for Multilateral Analysis

Policy institutions need the complete structural picture: all 26 KPIs across all 9 domains. WorldSim delivers this for every country simultaneously.

Income & Productivity (GDP per capita)
Cost of Living (inflation, electricity, rates, petrol)
Housing Affordability (rent, price-to-income, price-to-rent)
Fiscal & Tax Structure (debt, expenditure, revenue, tax wedge)
Labour Market (unemployment, crime, AI displacement)
Demographics (ageing, fertility, migration)
Social & Cultural (religion shares)
Energy (self-sufficiency, renewables)
Technology (internet, R&D, high-tech exports)
Multilateral Analysis

Questions WorldSim Answers for Policy Institutions

Each question maps to a scenario configuration, producing comparable distributional outputs across any set of countries.

ARTICLE IV

What is Greece's structural trajectory to 2050 under baseline conditions, and how does it compare to Ireland?

The core Article IV question: compare two EU members under identical conditions. WorldSim reveals that Greece has 69% stress probability vs Ireland's 8%, and that Greece's GDP distribution is uniquely asymmetric with +145% upside potential from its low base.

STRESS TESTING

Run the same energy + rate shock across all 27 EU member states. Which countries are most structurally vulnerable?

Apply identical tilts to every country. The Trajectory Index ranks structural resilience automatically. The coupling rules fire differently per country based on their structural position; energy-dependent countries suffer more than self-sufficient ones.

DEMOGRAPHIC SURVEILLANCE

Which EU countries face the most severe demographic-fiscal compound pressure over 25 years?

Compare fertility, ageing, migration, and their fiscal consequences across Southern, Eastern, and Northern Europe. WorldSim couples demographics to pensions, healthcare costs, tax base, and immigration needs: the full long-horizon structural picture.

GREEN TRANSITION

What are the distributional effects of the EU Green Deal across member states with different energy mixes?

Model the renewable transition (+20pp renewable share) on Germany vs France vs Poland. WorldSim captures the interaction between renewable integration costs, electricity prices, industrial competitiveness, and fiscal space.

CONVERGENCE

Are Western Balkans accession candidates converging structurally with EU member states?

Compare Serbia, Albania, or North Macedonia against the EU structural benchmark using identical KPIs and coupling rules. The Trajectory Index provides a single-number convergence metric with distributional depth behind it.

FISCAL SUSTAINABILITY

Under the reformed SGP framework, which member states can't meet their medium-term fiscal targets?

The new EU fiscal rules require structural fiscal plans. WorldSim stress-tests these plans under multiple macro conditions, showing which countries' fiscal trajectories are robust and which depend on optimistic assumptions.

Real-World Context

The Multilateral Questions That Define This Decade

IMF ARTICLE IV: GREECE 2024

Can Greece Sustain Growth While Servicing 154% Debt?

The IMF's 2024 Article IV for Greece asks whether the post-crisis recovery is structurally sustainable. WorldSim reveals the answer is highly path-dependent: the baseline shows 69% of paths hitting structural stress, but the upside potential (+145% GDP) is uniquely large, a bifurcating economy where policy choices make an outsized difference.

OECD ECONOMIC SURVEY: IRELAND 2024

Ireland's Growth Miracle, and Its Hidden Vulnerabilities

Ireland leads Europe in GDP per capita ($129k) and debt reduction (38% → 1% by 2050). But WorldSim reveals structural vulnerabilities: Housing affordability collapses (TI 0.10), rent rises 32%, and R&D spending falls 55%. The headline success story hides a housing and cost-of-living crisis that the OECD survey needs to flag.

EU DEMOGRAPHIC EMERGENCY

23 of 27 EU Members Below Replacement Fertility

Greece's fertility rate (1.31) is projected to fall further to 1.24 by 2050 while the 65+ share rises from 24% to 31.5%. Ireland's fertility also declines (1.44 → 1.09) but high net migration (+21.4/1000) partially offsets it. WorldSim's comparison engine quantifies these divergent demographic strategies and their fiscal consequences.

ECB CLIMATE STRESS TEST 2023

The Green Transition as a Structural Scenario

The ECB's climate stress test models energy transition risk for banks, but not the structural macro coupling that drives it. WorldSim models the full chain: renewable buildout costs, electricity price effects, inflation pass-through, industrial competitiveness, and fiscal consequences, for every EU country simultaneously.

Scenario Walkthrough

Greece vs Ireland: Structural Divergence to 2050

Two EU member states, identical baseline conditions, no tilts applied, yet radically different structural trajectories. This is the analysis that takes an IMF team weeks. WorldSim produces it in minutes.

Scenario Configuration

Countries
Greece & Ireland
Scenario Path
As Planned
Simulations
5,000 trajectories each
Tilts
None (pure baseline)
1

Ireland: TI 0.55, The Structural Success Story (With Hidden Cracks)

Ireland's headline numbers are extraordinary: GDP per capita surges 72% from $129,132 to $221,954. Debt collapses from 38% to 1% of GDP. Only 8% of paths hit structural stress. But the domain scores reveal vulnerabilities the headline misses: Housing Affordability is the worst in the simulation at TI 0.10 (rent +32%, price-to-income +21%), and Cost of Living scores just 0.23 (inflation doubles to 5.1%). Ireland is a growth engine with a housing crisis attached.

worldsimlab.com/explore — Ireland, As Planned, 5,000 simulations to 2050
WorldSim Ireland Overview — TI 0.55, GDP +72%, Housing TI 0.10
2

Greece: TI 0.43, 69% of Paths Hit Structural Stress

Greece's structural position is fundamentally different. GDP barely moves (-2.7%, $27,170 → $26,424) while debt rises from 154% to 169% of GDP. 69% of simulated paths hit structural stress. Demographics are severe: 65+ share rises from 24.3% to 31.5%, fertility falls to 1.24. But WorldSim reveals a critical asymmetry in Greece's GDP distribution: the P90 upside is +145% ($64,823) vs -60% downside ($10,554). This "bifurcating economy" pattern means policy choices matter enormously.

worldsimlab.com/explore — Greece, As Planned, 5,000 simulations to 2050
WorldSim Greece Overview — TI 0.43, 69% stress, bifurcating GDP distribution
3

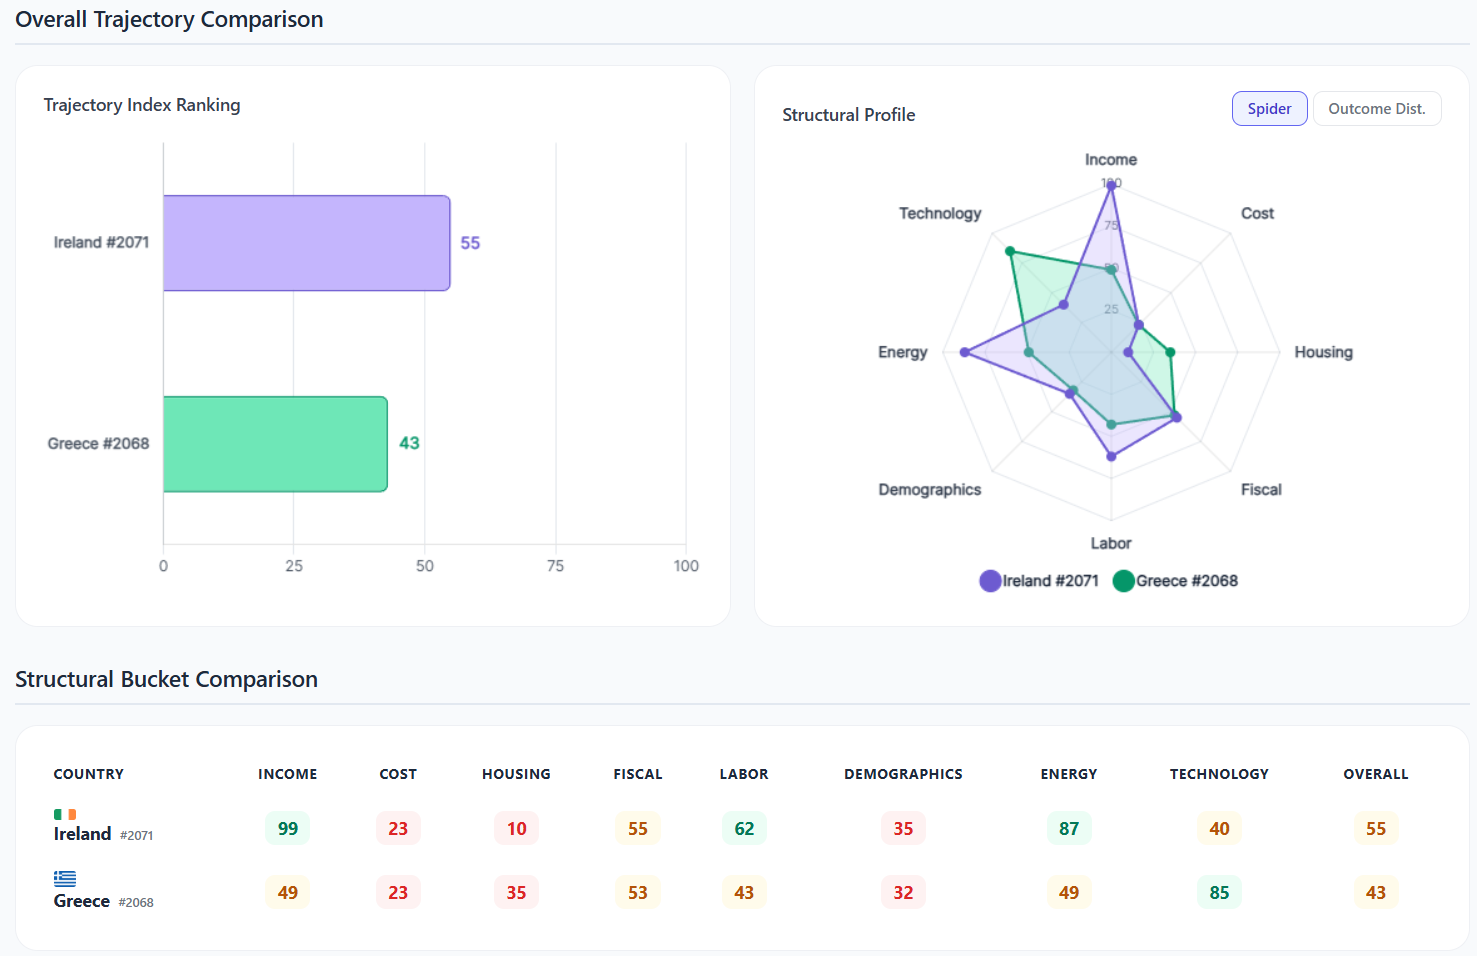
Head-to-Head: The Structural Profile Divergence

The Comparison Engine reveals the full structural divergence. Ireland dominates on Income (99 vs 49), Employment (62 vs 43), and Energy (87 vs 49). A striking finding: Greece leads on Technology (85 vs 40). This is counterintuitive (Ireland hosts Apple, Pfizer, and Intel), but the data supports it. Greece's R&D spending (1.49% GDP) is actually higher than Ireland's (0.96% GDP), and growing faster (+0.7pp over 2014-2024, among the largest increases in the EU). Ireland's R&D ratio is artificially deflated by its distorted GDP denominator, the "leprechaun economics" effect where MNE profits inflate GDP without proportional domestic R&D. WorldSim captures this structural trajectory: Greece is improving faster from a lower base, while Ireland's apparent R&D stagnation reflects a measurement artifact. Both countries share weak Cost of Living (23 each) and severe Demographic pressure (35 vs 32).

worldsimlab.com/compare — Ireland vs Greece, spider chart + bucket scores
WorldSim Greece vs Ireland Comparison — spider chart and structural bucket scores
4

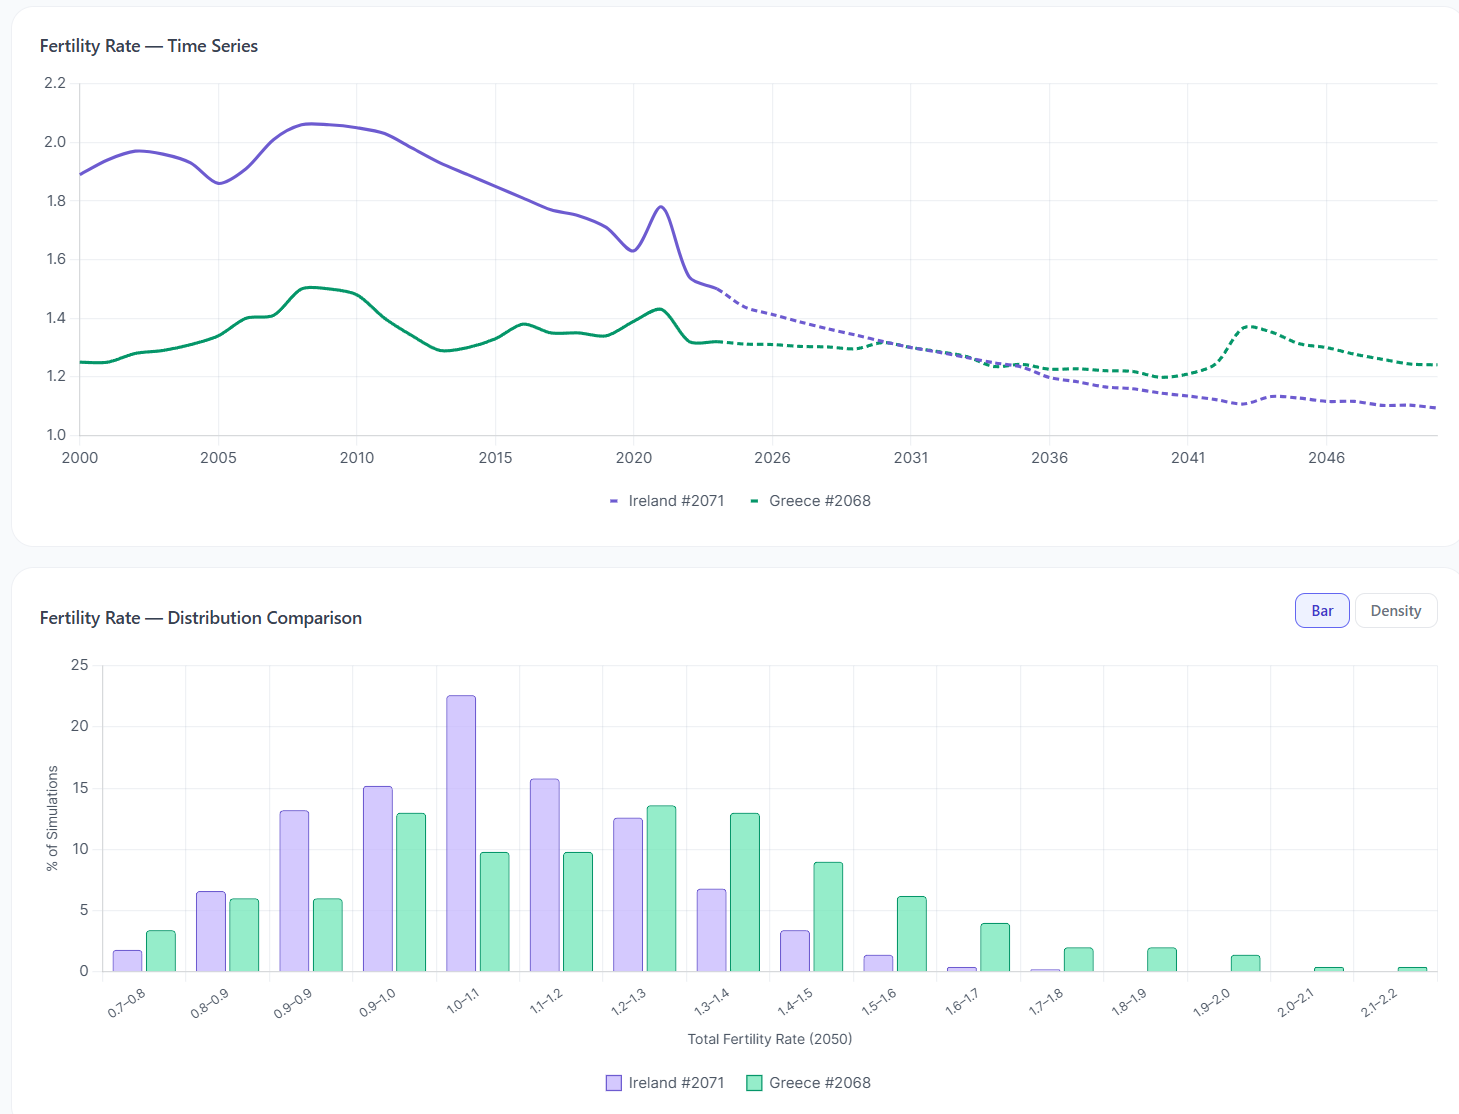
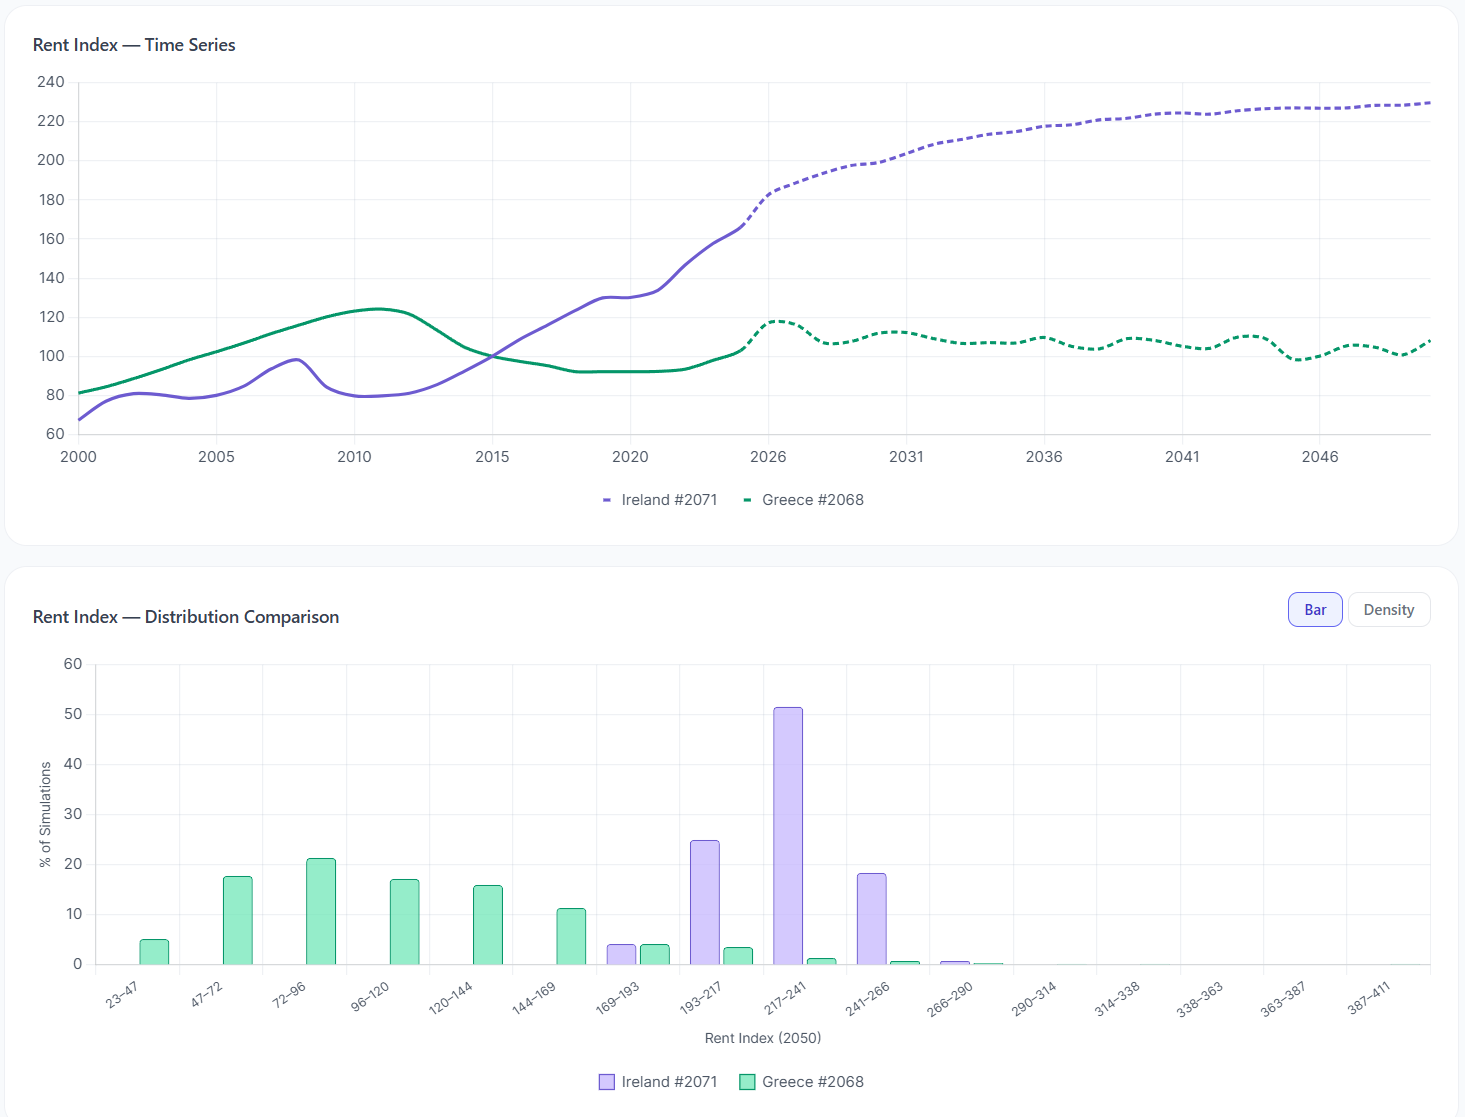
KPI Deep Dives: Fertility Collapse + Rent Divergence

The Comparison Engine drills into individual KPIs across both countries. Fertility tells a stark story: Ireland starts higher (1.44 vs 1.31) but both converge toward ~1.1 by 2050, the EU's shared demographic crisis. The rent index reveals opposite trajectories: Ireland's rents surge from 174 to 230+ (growth-driven housing crisis), while Greece's decline from 113 to 108 (stagnation-driven deflation). Same continent, opposite housing dynamics.

Fertility Rate: Time Series + Distribution
Fertility Rate Comparison — Ireland vs Greece converging toward 1.1
Rent Index: Time Series + Distribution
Rent Index Comparison — Ireland surges while Greece stagnates
5

Greece's Structural DNA: 55 Negative Rules Fire Under Baseline Conditions

Even with no tilts applied, Greece triggers 55 negative coupling rules vs 19 positive. The cascade begins in 2025: Energy Vulnerability (self-sufficiency <30%) and Migration Pressure fire simultaneously. By 2026, Fiscal Insolvency Alert activates (debt >120%). By 2027, Fuel Pressure, Monetary Tightening, and Demographic Winter Alert compound the structural stress. This is the audit trail that explains Greece's 69% stress probability: every rule, every year, fully transparent.

worldsimlab.com/explore — Greece coupling rules (19 positive, 55 negative)
WorldSim Greece Coupling Rules — 55 negative rules fire under baseline conditions

Key Takeaway for Policy Institutions

This comparison reveals what deterministic models hide: structural divergence is not about headline GDP; it's about the distribution of outcomes and the coupling rules that drive them. Ireland's TI 0.55 looks healthy, but housing affordability (TI 0.10) is a structural crisis. Greece's TI 0.43 looks weak, but the +145% GDP upside from a low base means policy interventions have outsized potential impact. An IMF team can use WorldSim to produce this comparative structural analysis for any pair of countries in minutes, with full transparency into which coupling rules drive the divergence.

Structural Analysis for Every Country

Compare any two countries, run identical scenarios across regions, and produce distributional structural outlooks, all with full audit trail transparency.