Germany vs Poland: Where to Build Your European Factory?
Two EU member states, baseline conditions, no tilts. The structural cost comparison that a site selection team needs, produced in minutes with full probability distributions.
Scenario Configuration
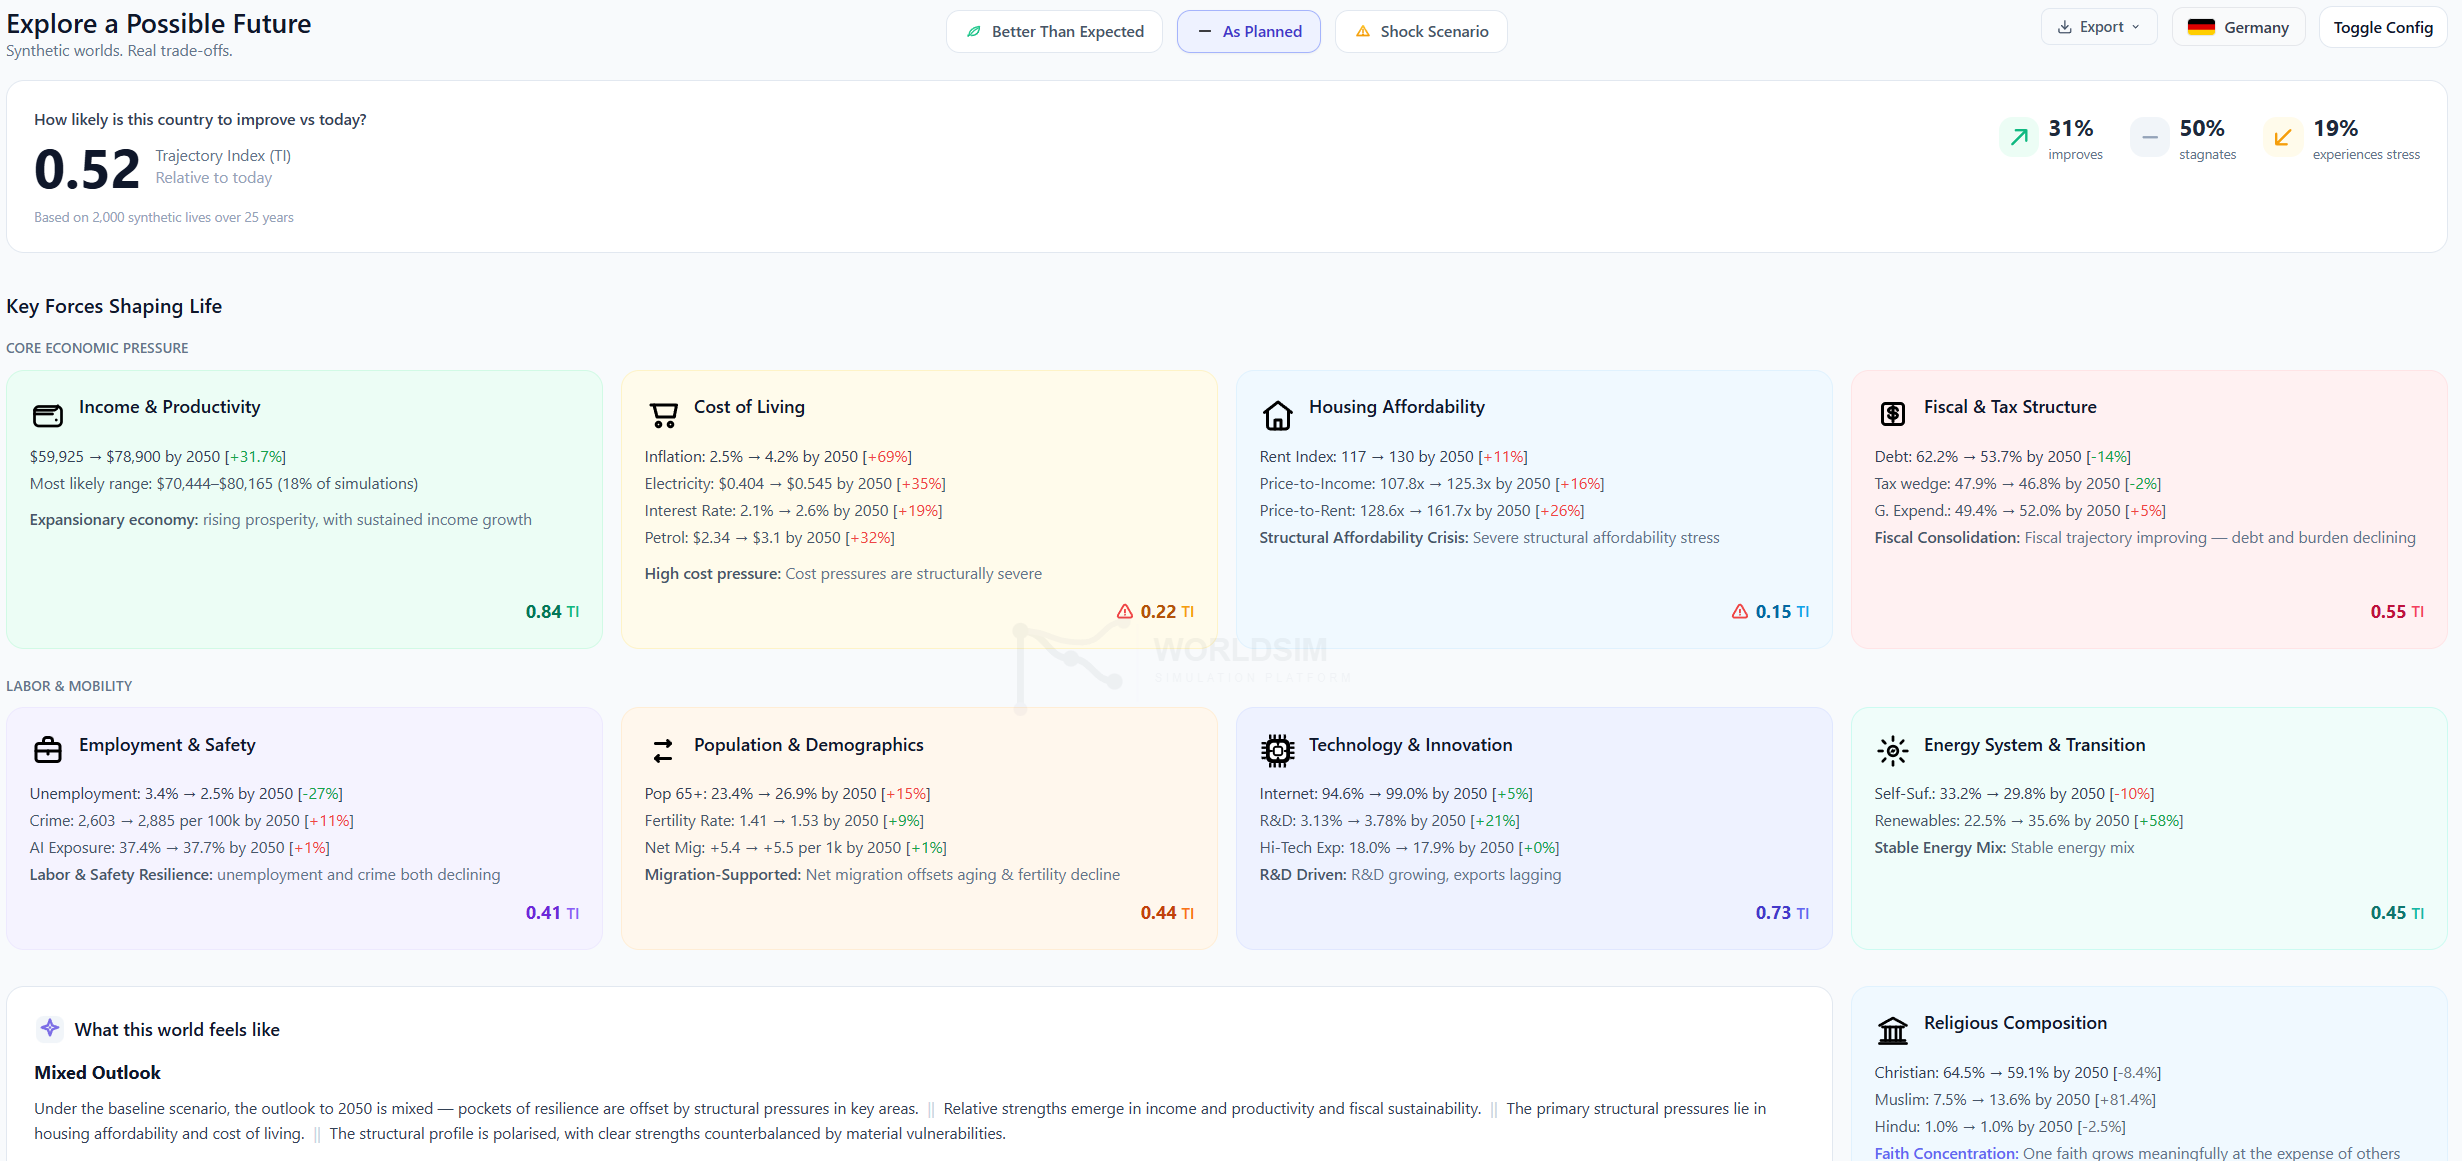
Germany: TI 0.52, Strong Growth but Severe Cost Pressures
Germany delivers GDP growth of +31.7% ($59,925 to $78,900) with strong Income (TI 0.84). But the cost picture is concerning: electricity rises 35% to $0.55/kWh, petrol reaches $3.10/L, and inflation hits 4.2%. Housing Affordability collapses to TI 0.15 (rent +11%, price-to-income +16%). The tax wedge remains high at 46.8%. Germany is a high-productivity, high-cost environment where margins are squeezed structurally.
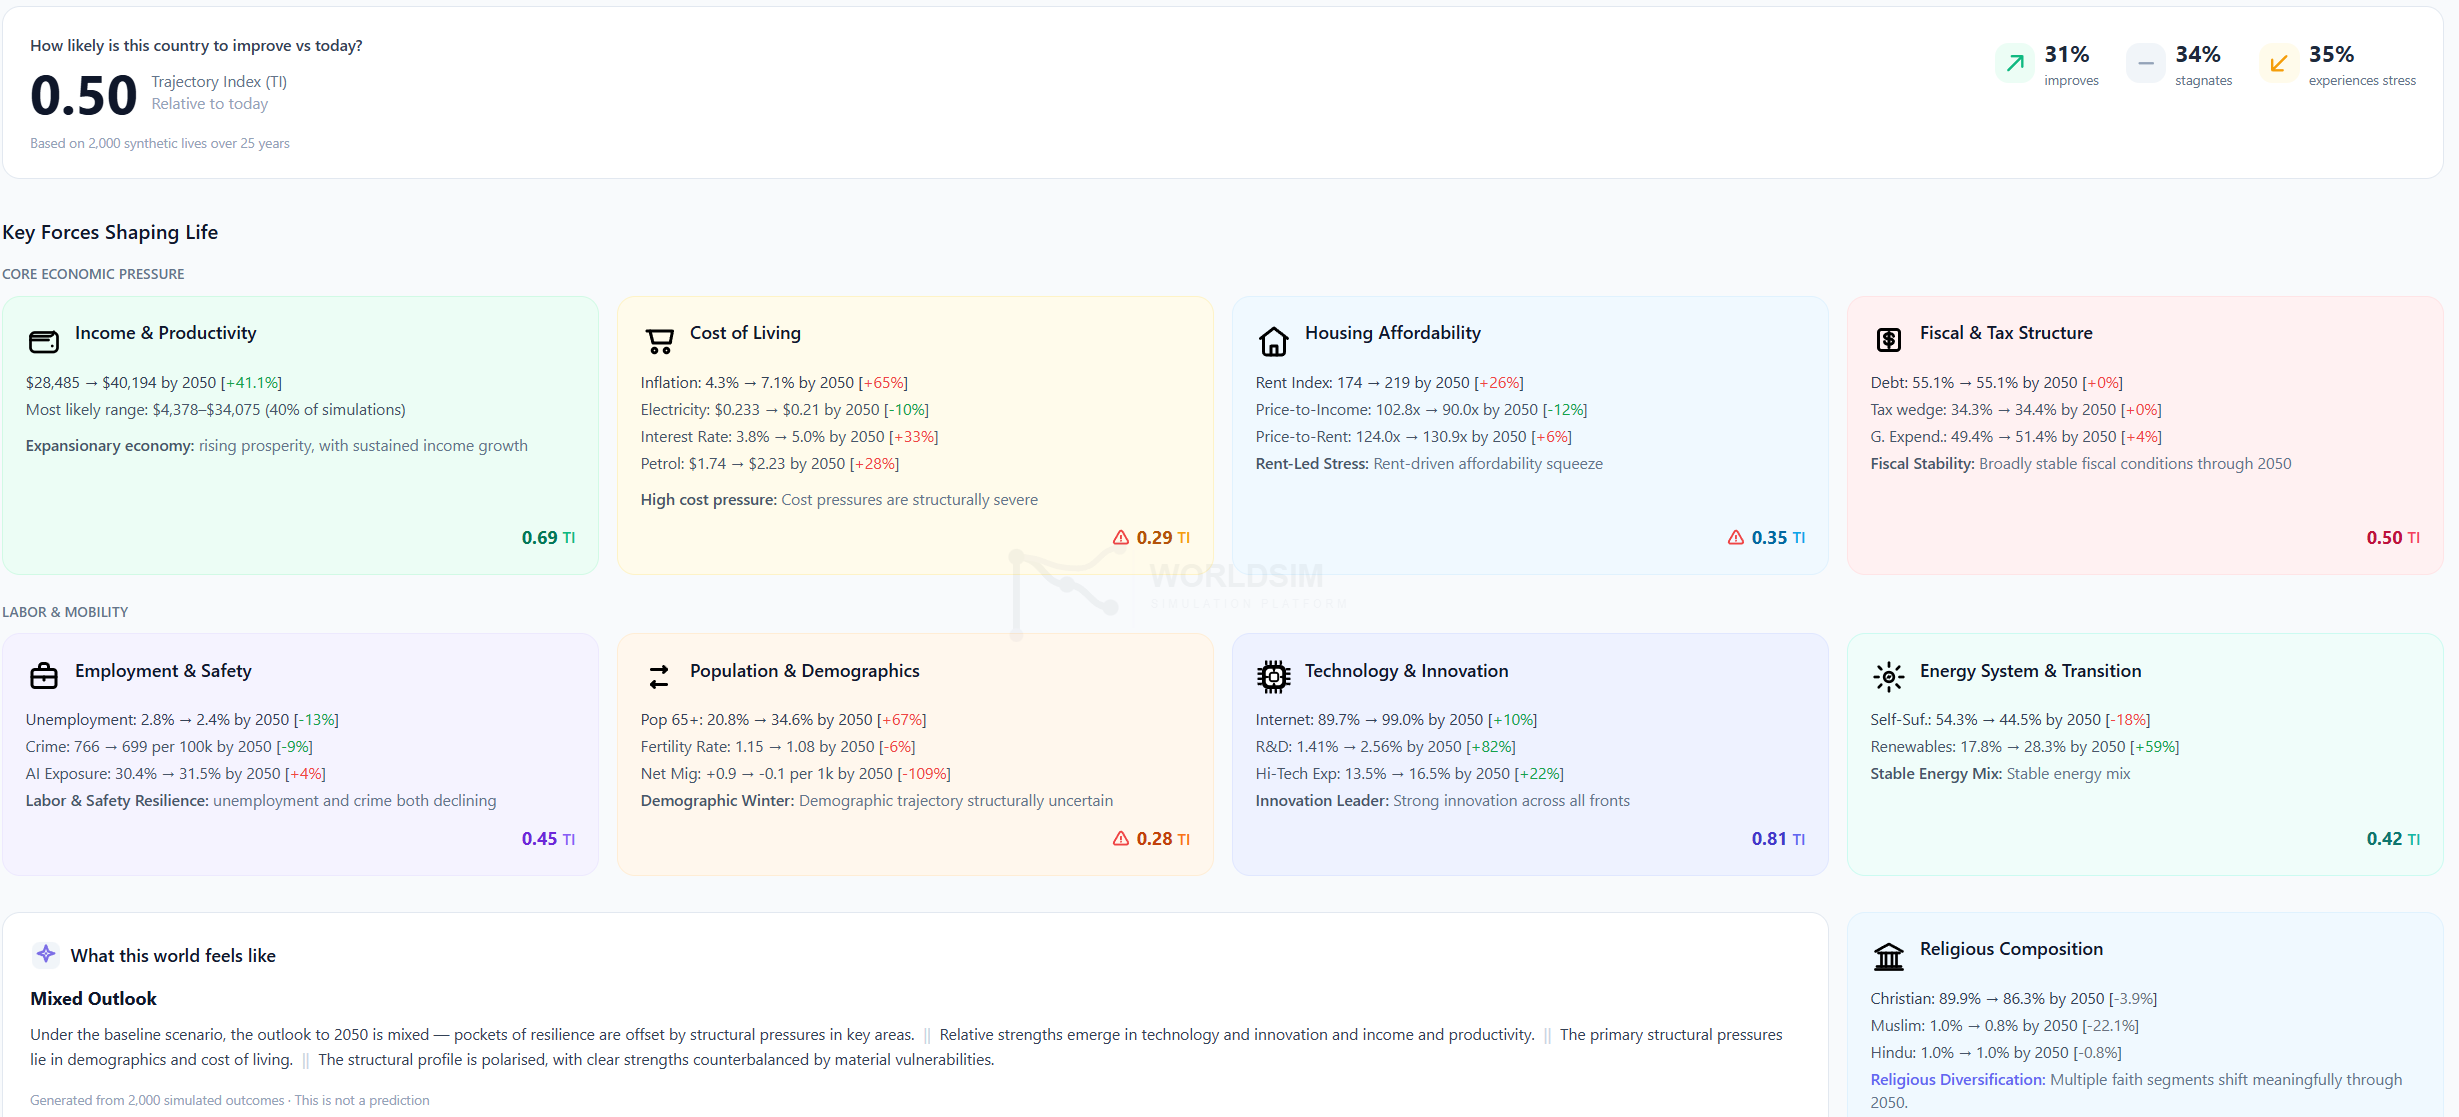
Poland: TI 0.50, Faster Growth but a Demographic Time Bomb
Poland offers faster GDP growth (+41.1%, $28,485 to $40,194) from a lower base, with significantly cheaper electricity ($0.21/kWh, 62% below Germany) and a 13.6pp lower tax wedge (34.3% vs 47.9%). But Poland faces a structural demographic crisis: the 65+ share surges from 20.8% to 34.6% (+67%), fertility drops to 1.08, and net migration turns negative (-0.1 per 1,000). This "Demographic Winter" classification means the labour pool that makes Poland attractive today will shrink dramatically over your investment horizon.
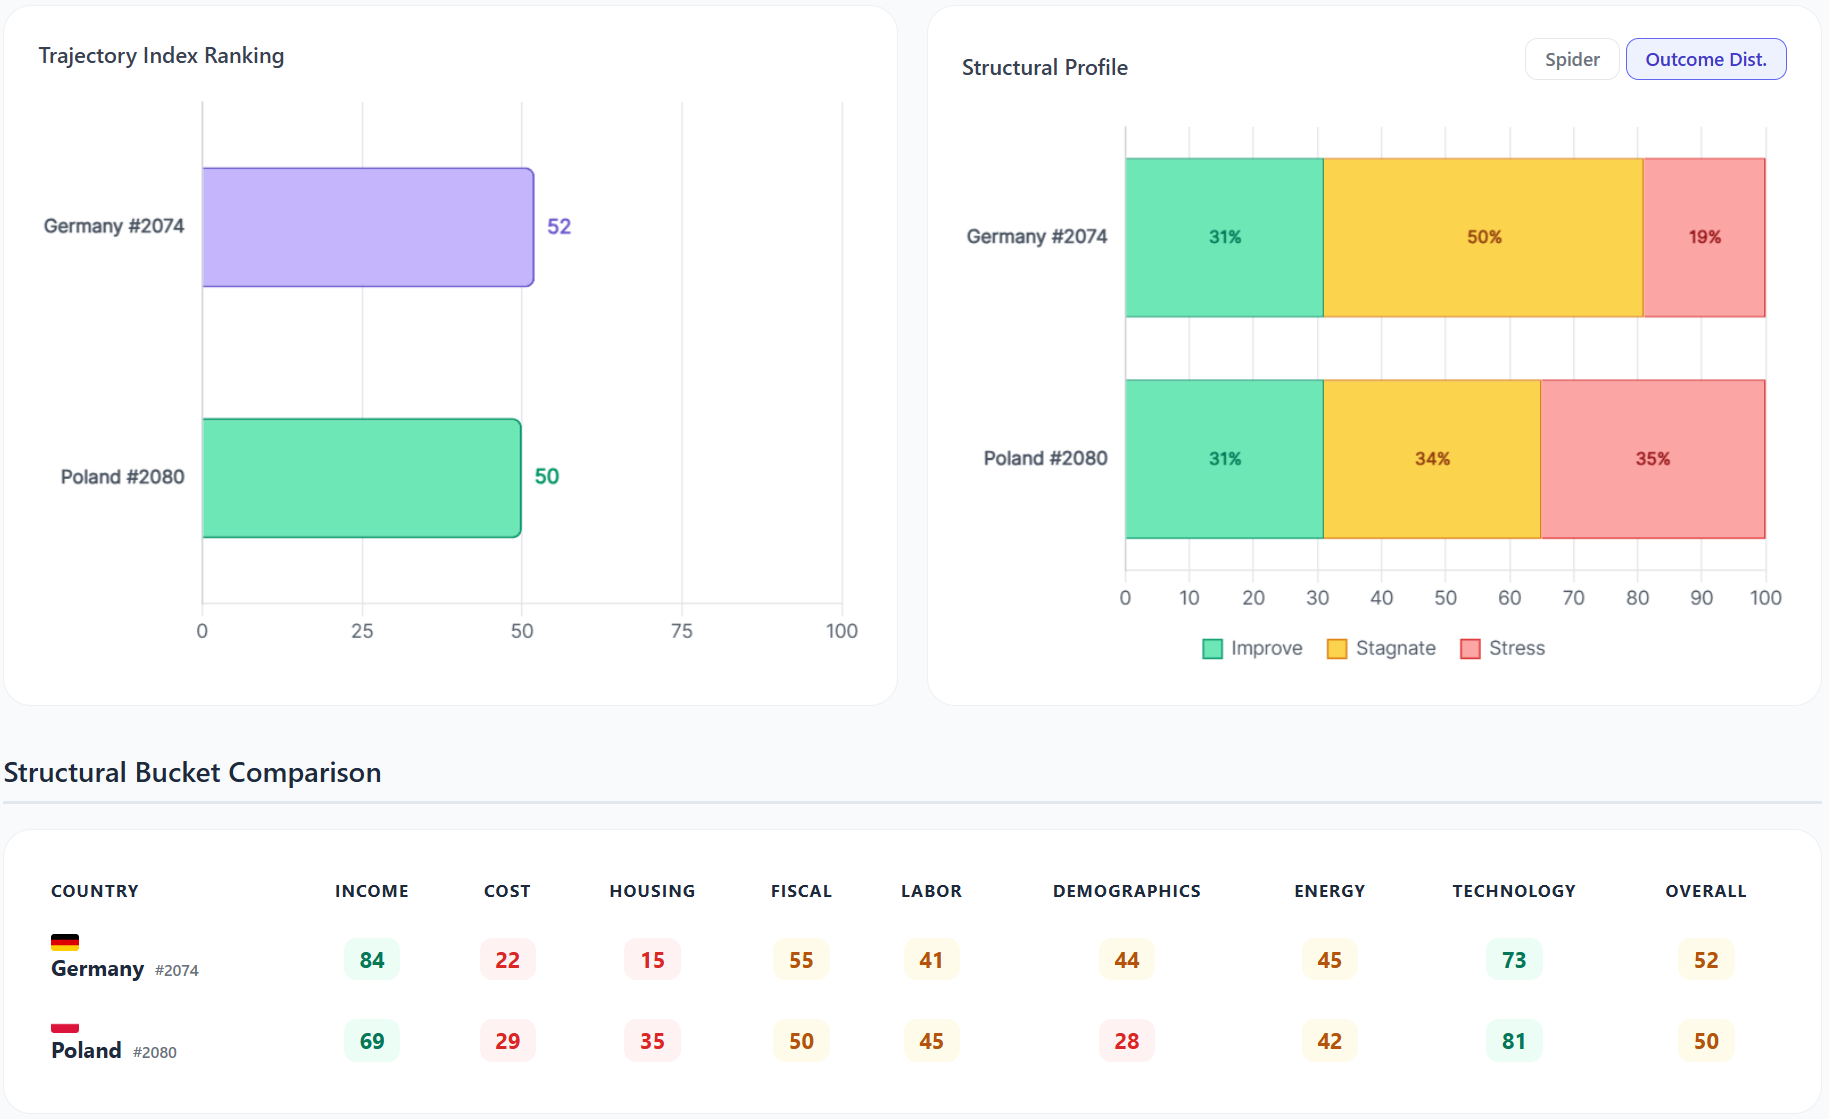
Head-to-Head: The Structural Trade-Off Quantified
The Comparison Engine reveals the core trade-off. Germany leads on Income (84 vs 69) and Demographics (44 vs 28). Poland leads on Housing (35 vs 15), Technology (81 vs 73), and Labour (45 vs 41). Cost of Living is weak for both (22 vs 29). Overall TI is nearly identical (52 vs 50), but the structural profiles are fundamentally different: Germany is a high-cost, high-productivity play; Poland is a low-cost, high-growth play with demographic risk. The outcome bars show Germany has less stress risk (19% vs 35%).
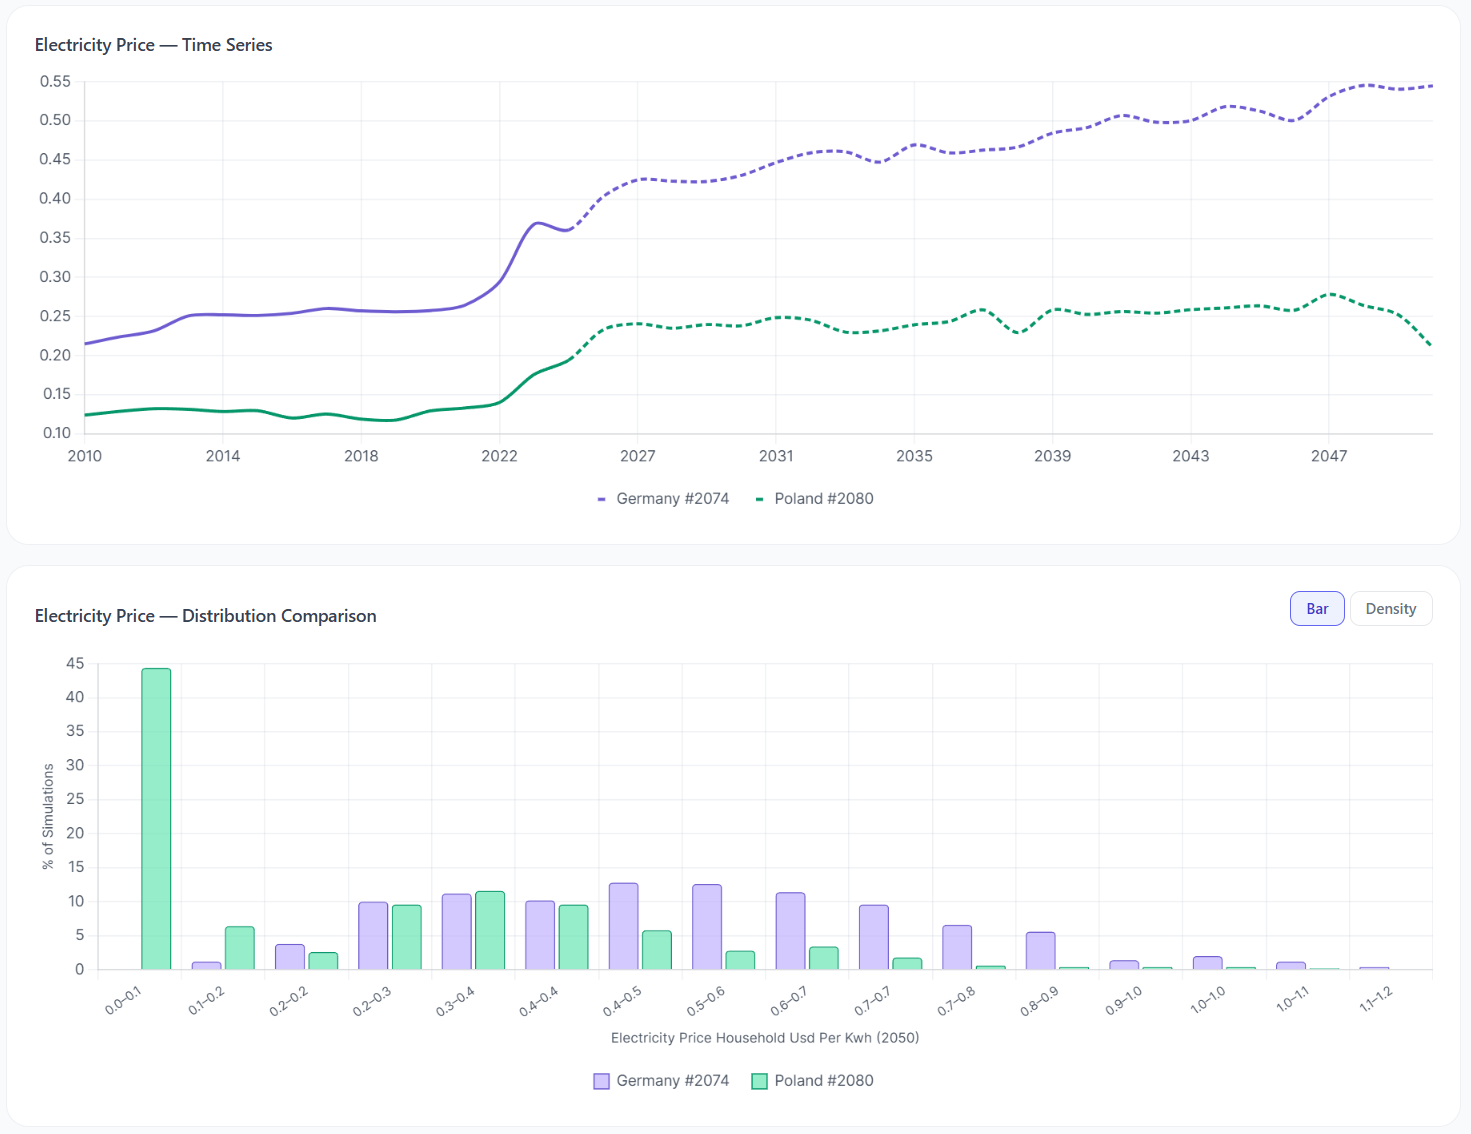
The Numbers That Matter: Electricity, Rent, and Crime
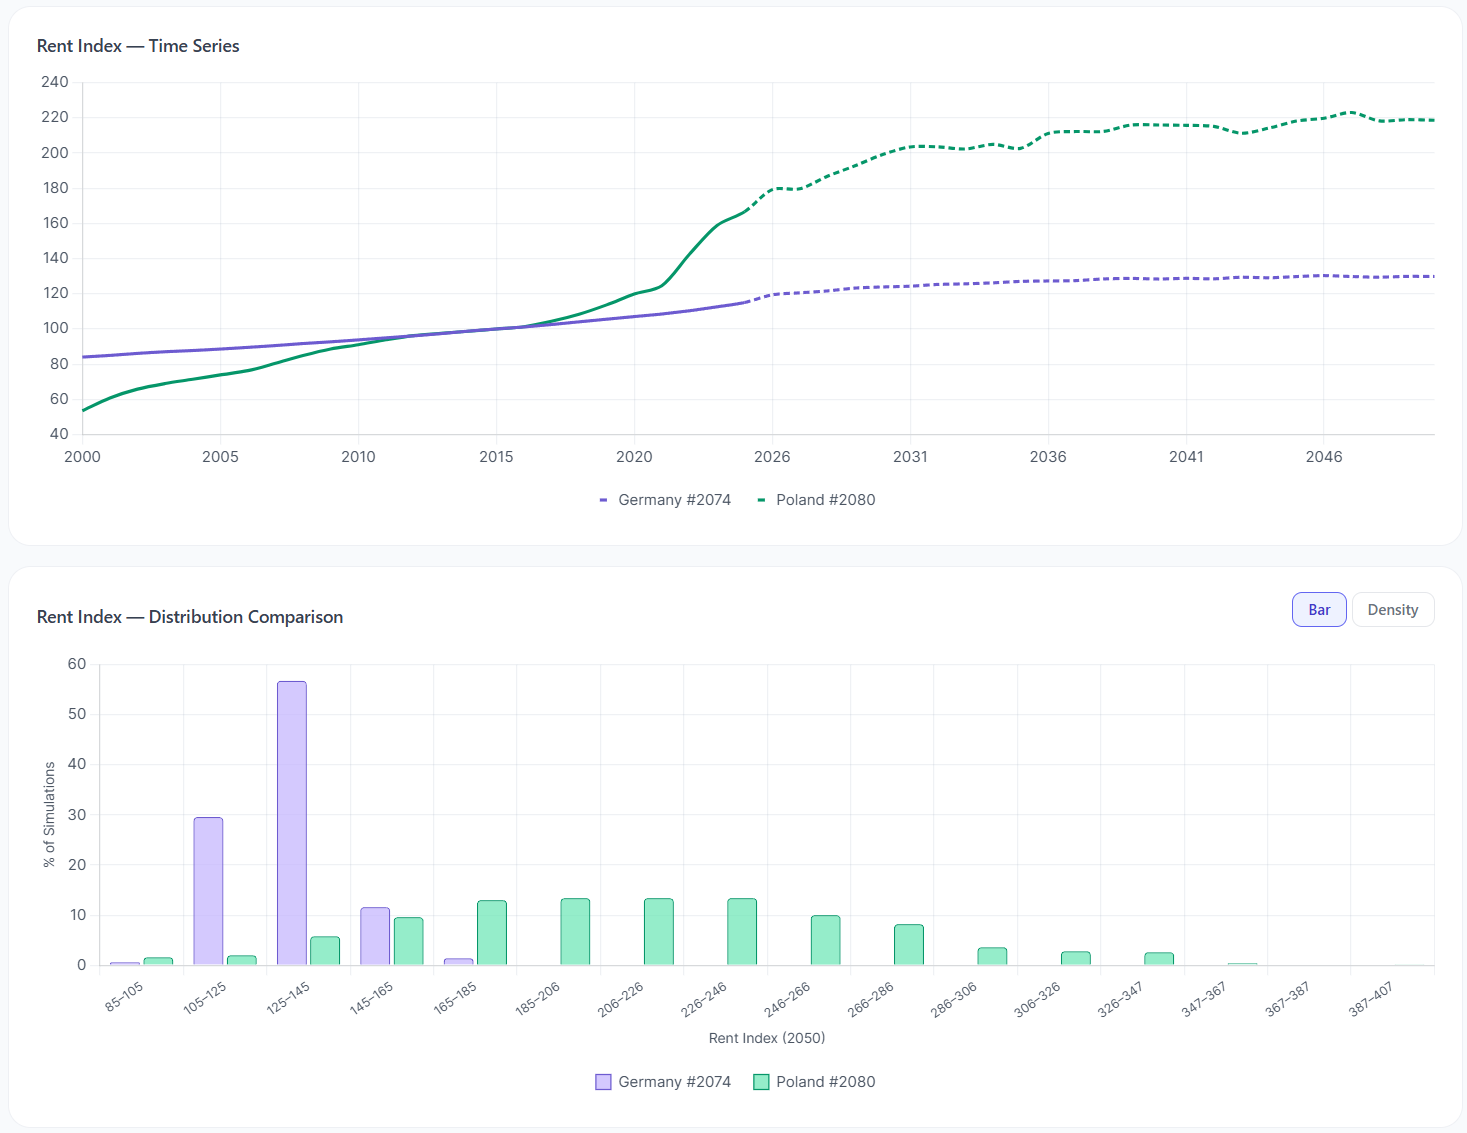
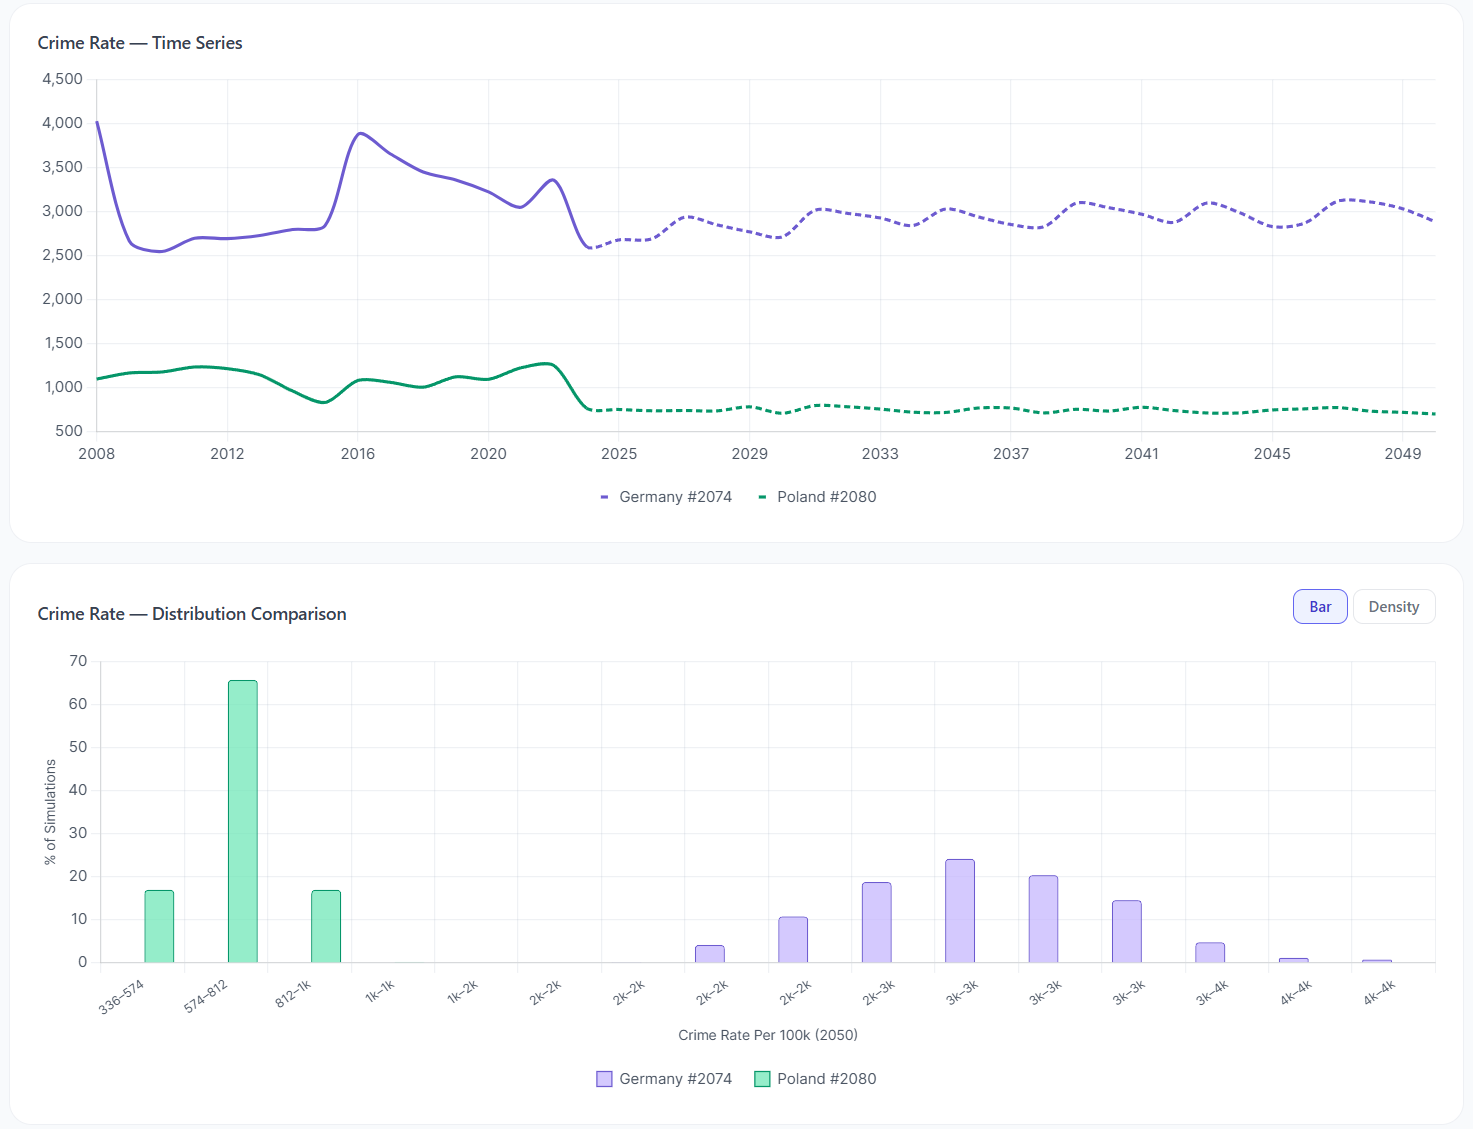
Three KPI deep dives tell the operational story. Electricity prices diverge dramatically: Germany's costs climb from $0.40 toward $0.55/kWh while Poland stays below $0.25, a persistent 2.5x cost advantage for energy-intensive manufacturing. Rent tells the opposite story: Poland's rent index surges past Germany's as its economy grows, eroding the office-cost advantage. Crime rates show Poland consistently safer (699 vs 2,885 per 100k), relevant for employee relocation and security costs.
Key Takeaway for Corporate Strategy Teams
Germany and Poland score nearly identically overall (TI 0.52 vs 0.50), but their structural profiles are fundamentally different. Poland wins on cost: 62% cheaper electricity, 13.6pp lower tax wedge, lower crime, and faster GDP growth. Germany wins on stability: better demographics (44 vs 28), lower stress probability (19% vs 35%), and a deeper labour pool. The critical risk for Poland is demographic: a 67% increase in the 65+ share and negative net migration by 2050 means the cheap labour that attracts investment today may not be available tomorrow. A corporate strategy team using WorldSim can quantify this trade-off with full distributional outputs, test "what if" scenarios on any cost variable, and present the board with a probabilistic investment case rather than a static spreadsheet.