Every long-horizon country forecast you have ever read is one path through a much wider distribution. The variance is the signal. We just made it visible.
Most economists predict a number. The world is a distribution.
Most institutions publish long-horizon country forecasts as a single line. GDP grows X% per year. Public debt reaches Y% of GDP by 2035. Population over 65 hits Z%. The number is precise, the methodology is conservative, and the report is impressive.
But that number is one path. The world the country actually lives in is a probability distribution around it, with variance that is often wider than the difference between any two competing forecasts.
WorldSim is a probabilistic socio-economic world simulation platform for long-horizon scenario exploration through controllable, reproducible synthetic environments. Four things make it different from a single-point forecast:
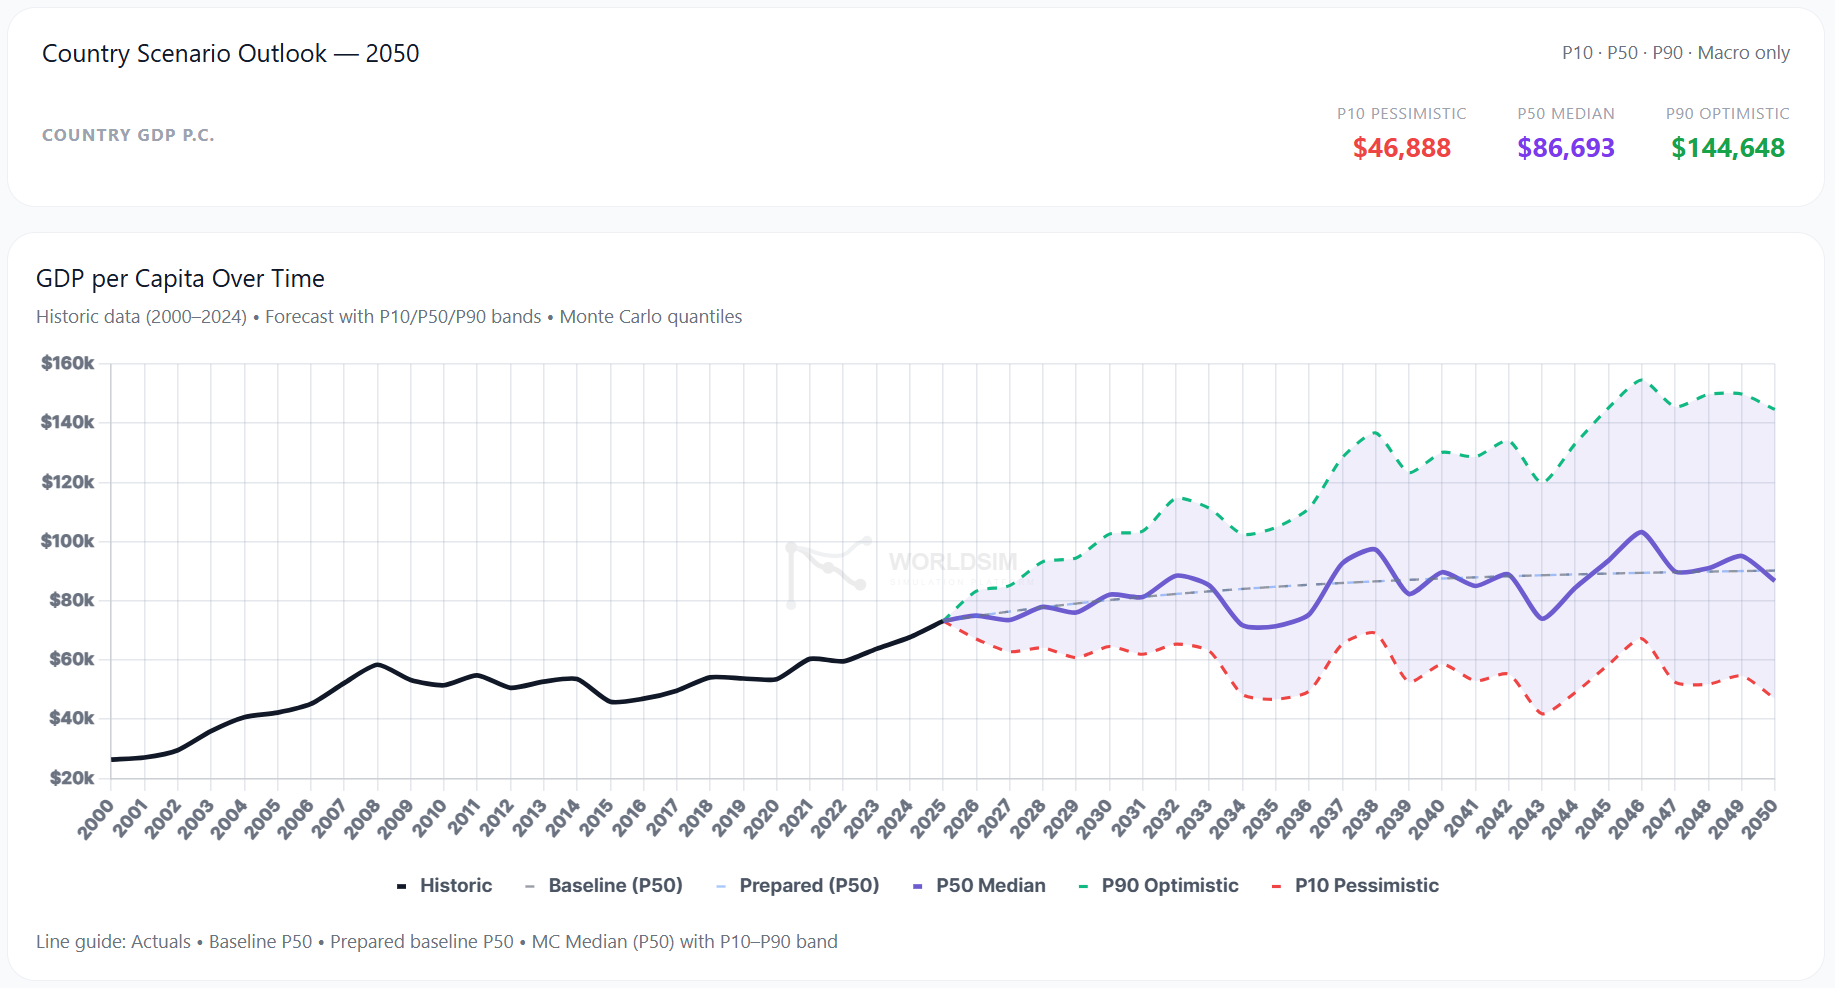
Most institutional forecasts give you the median path. WorldSim's job is to show you the rest of the cone around them. The path you read about in a report is one of the 10,000 we generate. The other 9,999 are where the structural risk lives.
For a finance minister building a budget around "GDP grows 1.8%", the question is not whether the median is right. It is what the P10 looks like and how much policy space exists when fiscal stress, demographic decline, and an external shock fire together. That is where the cone matters.
When you stop predicting and start exploring:
Every long-horizon forecast you have ever read is one path through a much wider distribution. The variance was always the signal. We just made it explorable.
That is the difference between predicting the future and exploring it.
The complete manifesto walks through how the four differentiators show up across real countries, with worked examples from Greece, Germany, Spain, and Finland.
Read on Substack →Run any of 195 countries through 10,000 Monte Carlo trajectories connected by 100+ structural coupling rules.
Try WorldSim →