Portugal and Spain end 2040 on the same per-capita income, in the same regime, having paid for it with opposite structural crises.
Portugal and Spain get lumped together. Iberian peninsula, post-2008 cousins, shared gas market, same EU funding wave. Two variants of the same story.
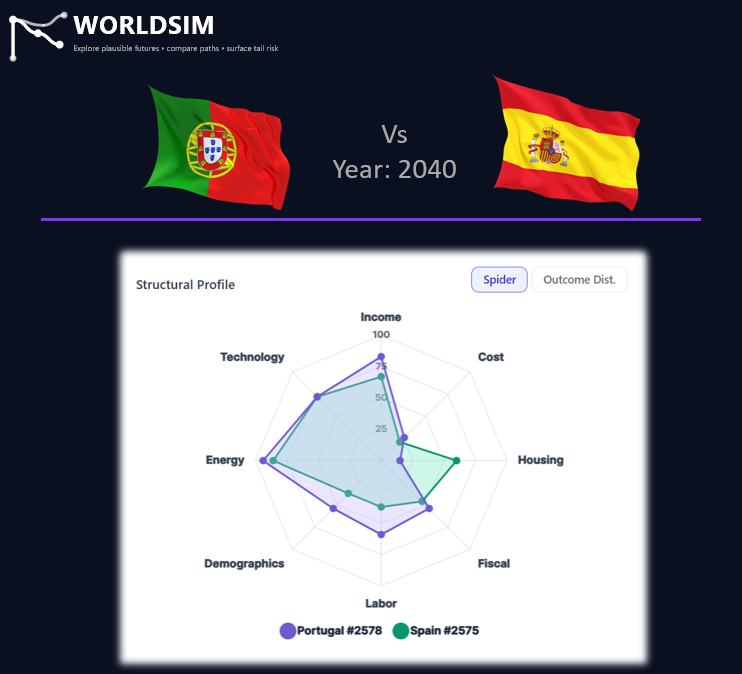
The data disagrees. Across the three KPIs that most shape long-horizon country outlook, Portugal and Spain crossed over in the last decade. Fertility crossed in 2014. Housing affordability crossed in 2018. Public debt crossed in 2022.
Portugal had Spain's TFR for most of the post-Salazar era. Then Spain dropped harder. By 2040, the WorldSim baseline lands:
Spain converges with Korea on the demographic axis. Portugal stays inside replacement-adjacent territory. Same peninsula, different long-run population pyramid.
Lisbon went vertical. Madrid stayed Madrid. The rent and price-to-income spread between the two capitals widened sharply after 2018, driven by Lisbon's golden-visa-era capital inflows and short-term-let conversion that Spain restricted earlier and harder.
Portugal pays for its housing crisis on the cost-of-living axis. Spain pays for its demographic crisis on the working-age axis. Different bills, same total.
Spain's debt path is now structurally heavier than Portugal's:
Portugal exited the troika programme with discipline that has held. Spain's fiscal headroom narrowed through the 2020s. The 2022 crossover sets the long-run trajectory.
The headline result is uncanny. By 2040 the two countries' GDP per capita are roughly the same (Portugal $41,838, Spain $43,992) and both sit in the same broad macro regime. They get there through opposite structural signatures. Spain's growth slows because the workforce shrinks. Portugal's growth holds because households pay through housing and rent.
Three crossovers in a decade. Same peninsula. Opposite structural signatures. Which one reverses first?
The complete comparison walks through every coupling rule that fires for each country, the divergence drivers, and what the convergent 2040 endpoint actually means.
Read on Substack →Use the Compare page to run Portugal and Spain side-by-side, or any pair from 195 countries on identical assumptions.
Try WorldSim →